Tag Archives: CrossFit

No big changes: Castro is still wrong, a single workout doesn’t predict things well, and 300 is a magic number

Here’s a summary post for my series on predicting regional qualification from single-workout performance during the CrossFit Games Open.

I’ve again copied the leaderboard data from the Games website for the top 180 women in the five regions indicated in my first post (additionally, I’ve added a sixth region with the dataset used in these analyses, the South Central region, only because I couldn’t remember if I took SoCal or S. Central last time).

“You should not go to Regionals, you should not go to Regionals if you don’t have a basic move like the muscle-up. Period.” – Dave Castro

No, Dave Castro, you do not need to have a muscle-up to qualify for Regionals… although it would help.

The results of 2014’s CrossFit Games Open were similar to past years in that there was a high range in overall score in the top 48 in each region, and there were atheletes that qualified for Regionals that did not complete a muscle-up in 14.4.

The overall score ranged from 16 to 516 total points for women qualifying for Regionals – this is consistent with previous years, and my estimate that 500 total points would be about the cut-off for Regional qualification (Fig. 1).
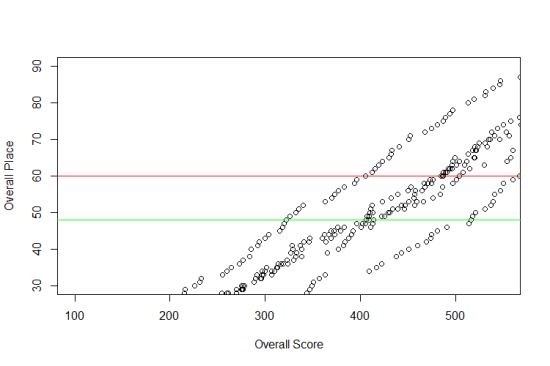
Figure 1: A subset plot of overall score against overall place in six regions during the 2014 CrossFit Games Open. The green line is drawn to show 48th place, and the red line shows 60th place. Athletes finishing 48th scored between 322 and 516 points.

In the leaderboard data I analyzed, four women qualified for Regionals that did not complete a muscle-up in 14.4, but each did achieve a score of 180 on that work out, meaning they completed all the Power Cleans, and probably had some time to attempt a muscle-up. These women did place relatively high in the overall regional placement (each placed 39, 46, 47 and 48), but they still qualified.

And, this is exactly what we’ve seen in the past; the Open workouts are broad enough that a single movement will not necessarily disqualify an athlete.

Five workouts still serve a purpose

Somewhat mundanely, 2014’s Open competition supports my original conclusion: predicting regional qualification from a single workout’s performance is useless.

Figure 2 is similar to Figure 2 in a previous post, but includes only leaderboard data from 2014. Again, the r-squared of the regression (red line) is low (0.33), suggesting that a single workout score is little indication of how an athlete with place in the end and, therefore, whether or not she will qualify for Regionals.
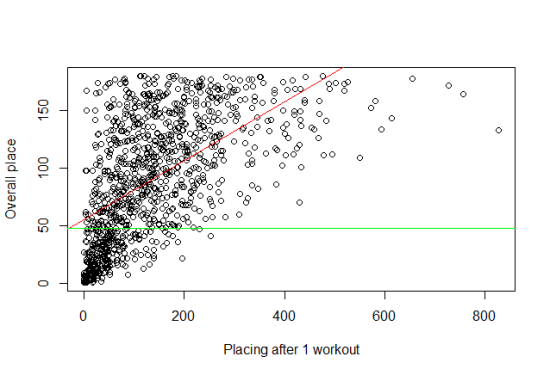
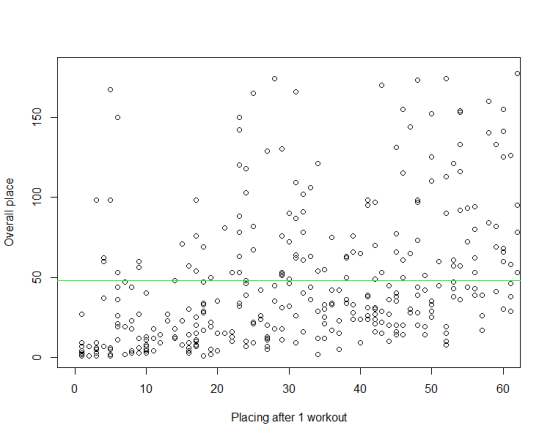
Fig. 2: Placing in a single, randomly-drawn, workout from the 2014 CrossFit Open regressed against overall place at the end of the Open. A regression line is plotted in red, and the regional qualification cut-off (48th place) is presented in green.

Let’s magnify again:

Fig. 3: Same plot as Figure 2, except the x-axis view is limited to 60.

Now, think about it this way: An athlete places in the top 60 on an Open workout (or even in the top 10)… will she qualify for Regionals? Figure 3 says: who knows!? There are plenty of points above the green line in this plot, which represent athletes who finished in the top 60 in at least one workout, but didn’t make it to Regionals.

Let’s wrap it up

From a predictability standpoint, the 2014 CrossFit Games Open wasn’t that different from 2012 or 2013. Not even muscle-ups were as hard a line as Castro predicted.

The range of overall scores were similar: a total point score of ~500 was the cut-off in all three years.

The maximum placing was similar; I predicted getting over 300th place in any one workout will doom a competitor from qualifying for Regionals, and guess what the maximum place for a Regional qualifier was: 322 achieved by Hanna Gartman of CrossFit Hardcore North finishing 47th in the South East. Behind her was Becky Conzelman of Backcountry CrossFit, having a maximum placing of 294, but finishing 47th in the South West region. Importantly, Becky’s profile reports that she’s 42 years-old. Of regional qualifiers, she had the second worst performance across six regions in a single workout, but she still rocked it hard enough to qualify… at the individual women’s level, not just masters’ level. Awesome.

And the regional qualifier with the third worst performance in any single 2014 Open workout was… Allison Brager, of CrossFit Terminus, finishing 44th in the South East with a maximum placing of 273. So perhaps her worry of qualifying for Regionals as an individual was justified…

The Final Countdown: An Overall Score Cut-off

CrossFit Games Open workout 14.5 will be released in about 24 hours, and there are many athletes still on edge about qualifying for Regionals.

The Question

My overall score is 466, is it too late? Is this likely to disqualify me from Regional qualification?

Remember, the overall score is calculated by summing each of the placings for each Open workout. So if you place 1st, 2nd, 11th, and 1st in the past four workouts within your region, your score is 15 (and your awesome and likely named Emily Bridgers). The score can quickly get jump though, given the huge number of competitors there are… something like 5,000 women in just the South East region.

Let’s look at a simple plot to see what has happened in 2012 and 2013.

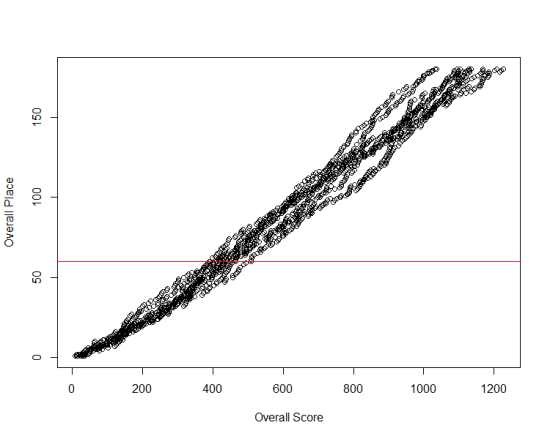
Fig. 1: Women’s overall score plotted against overall place in Open competitions 2012 and 2013 within five CrossFit Regions. The red line is drawn to illustrate the top 60.

Figure 1 shows overall scores against overall placings for women after completion of the Open competition in five Regions across two years. If I were to draw a trend line or linear regression, you’d see a positively sloped line following the center of that cloud of points.

However, there is variation – not all of those points would fall along the trend line.  And to make my point clearer, let’s zoom in:

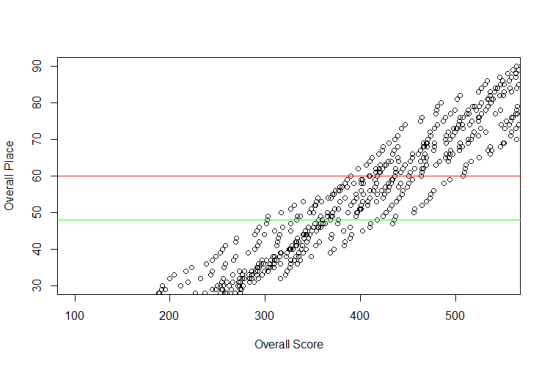
Fig. 2: A magnified portion of Figure 1 illustrating ‘edge-qualifiers’. The red line indicates top 60, and the green line indicates top 48.

Look at the red line: Any points that lie on the line are individuals who placed 60th overall. Their overall scores ranged from 390 to 508. Similarly, any points on the green line are individuals who placed 48th (the Regionals cut-off for 2014). Their scores ranged from 302 to 435. The minimum score in the Top 60 was 7 attained by Lindsay Bourdon and Julie Foucher of the South East and Central East, respectively.

Big Picture

So there is some overlap in the ranges (years and regions can vary), but the point is that 500 points is a rough cut-off for ‘edge’ athletes. At 466 points after four workouts, there is a lot of pressure to keep the score low in 14.5. Low as in top 50.

I also want to emphasize something. Variation: This is NOT all of it. The data I have is a tiny sub-sample of all the Open data on http://games.crossfit.com. This means that my 500 point cut-off is conservative. With more data, the cut-off will probably increase. Additionally, because no one has made the Top 60 with a score above 508 in my data set, does not mean it can’t or won’t happen this year. The Open is more competitive this year; there are more athletes registered that can cause more dramatic swings in scores… which will only lead to increased variation, and a higher score cut-off for 2014.

Lastly, if it wasn’t obvious, Allison Brager, my wife, is my imaginary CrossFit competitor inquiring about her score and chances of Regional qualification in this year’s Open. I’m a scientist: I’m trying to be objective and realistic. This is not a fluffy, “you can do it”, feel-good, post to encourage her to perform well in 14.5. I sincerely believe she can make it – I would have written this with much more cynicism if I didn’t (she knows that I’ll call her out if chances, acts, or statements are bullshit…).

Are muscle-ups that important, Castro?

In previous posts, I’ve presented on the range of Open workout placings athletes have and its impact on CrossFit Games Regional qualification. These results were posted in a series entitled “Predicting regional competitors from single open workouts” and can be found here:

I believe these results partially counter Dave Castro’s statement during the introduction to Open workout 14.4 (around minute 37:00 here):

We wanted the best of the best to be able to finish it and get back to the rower. … You should not go to Regionals, you should not go to Regionals if you don’t have a basic move like the muscle-up. Period.

The Open is changing year-to-year, becoming more competitive and more challenging to qualify for Regionals, but one thing my posts have illustrated: there is a lot of variation and a single Open workout is a poor predictor of regional qualification.

So how can Castro make this claim? Have muscle-ups been a deciding factor in Regional qualification in the past?

No.

In fact, muscle-ups have been featured in the past two Open competitions during the Karen-esque, miserably painful 12.4 and 13.3, and there were plenty of Regionally qualifying women who didn’t perform a single muscle-up during these workouts. Indeed, 39 in 2012, and 5 in 2013 just from my sub-sampled data set (described in my first post).

The range in scores for 12.4 and 13.3 for Regional qualifiers (overall place is less than 60) in my data set: 240-270, and 240-273, respectively. This means that an athlete needed to complete double-unders, (the workout was 150 wall balls, 90 double unders, then muscle ups), but muscle-ups were optional…

But… the Open is becoming more competitive. It was much harder to get to Regionals last year than in 2012 without muscle-ups (i.e., 39 athletes in 2012 versus 5 in 2013 in the sub-set I’m working with).

So Castro might be right this year: Perhaps no one will qualify for Regionals this year that doesn’t compete a muscle-up in 14.4. We can only, anxiously wait. But the way I see it: CrossFit is more than a muscle-up, and the Open generally does a good job of demonstrating it.

Update 4: Predicting regional competitors from single Open results

Original post
Update 1
Update 2
Update 3

In previous posts, I’ve presented on the range of Open workout placings athletes have and its impact on CrossFit Games Regional qualification. Here, I’ve produced some simple, linear regressions that try to predict overall place during an Open competition from knowledge of one to four individual workout placings.

The Question

A question one might ask is: I am currently ranked at 100th overall  after 14.1 and 14.2, how well does this placing predict my ranking by the end of the Open competition?

Short answer: It doesn’t.

Long answer: Not very well. Let’s demonstrate what I mean with another set of plots.

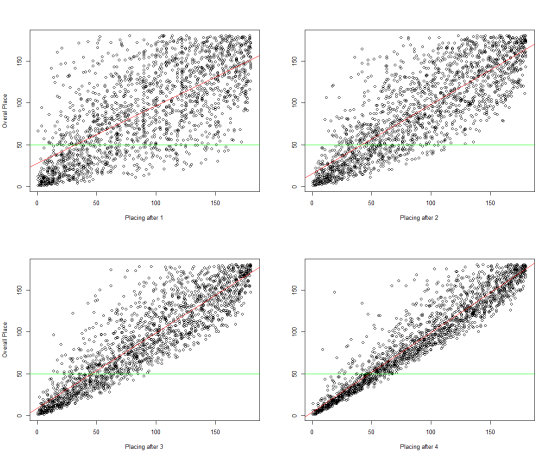
Fig. 1: Scatterplots with regressions (red lines) of overall placings after 1, 2, 3, and 4 Open workouts and Overall Placing at the end of a given Open. Each point represents an individual’s rank or place after a given number of workouts plotted against her finishing, overall place. A green, horizontal line is drawn at 50, demarcating regional qualifiers.

Click on the image to make it bigger. Figure 1 shows four regressions performed after plotting an individual’s overall placing after 1, 2, 3, or 4 Open workouts against her finishing, overall place.

Let’s look at the top left plot. An athlete performs the first workout of the year, and she scores 100th. This plot says: there is no way we can accurately predict how she will finish. While the regression is statistically significant, the r-squared is 0.48, which isn’t very high. Just look at all the variation!

Now take a look at the top-right plot. After two workouts, the data tighten (this is partially an artifact of how I produced these data) and are better predicted by the red regression, but there is still a huge amount of variation that doesn’t fall directly on that red line. If all the points fall on that line, it suggest that we can easily predict overall place from placings after a given number of workouts. The r-squared is increased to 0.67, but someone ranked 100th after two workouts still has a good chance at qualifying for Regionals – that is, there are still a good number of points falling below the green line where x = 100.

Notice that the data get closer to the red line (the regression) as more workouts are added. Makes sense: if you’re ranked 100th after four workouts, it’s pretty unlikely that the 5th workout will swing you up or down too much in the overall rankings. But it does happen.

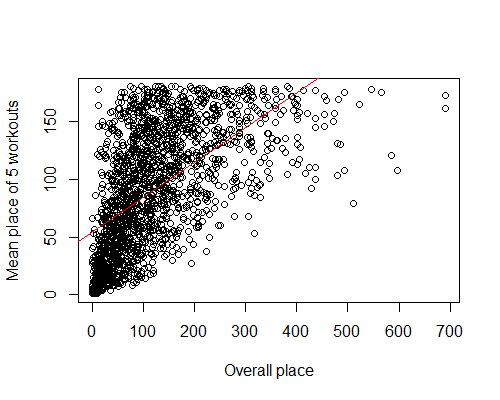
I generated the mid-Open rankings (overall placings after 1, 2, 3, and 4 workouts) with the sample() function in R, which gives me some ‘randomness’. For instance, sample() was used to randomly select two workout-specific placings of the total five for a given athlete and given Open competition. Thus, ‘Placing after 2 workouts’ is not an athletes actual placing after 12.1 and 12.2, it’s a placing I calculated after drawing, at random, 2 of the 5 workouts for that athlete in 2012, and them ranking them with another R function (rank()). A problem with this approach: maximum rankings are capped at 180 for all the plots, but an athlete could have been ranked much higher in the actual Open. Figure 2 is an example where the actual workout placings are considered and used to predict overall placing. This is the same data as the top-left plot in Figure 1, but I haven’t ranked it myself.  The data don’t even appear to be linear (the data look to be curving upwards), and the r-squared of the regression has fallen to 0.38.  I can’t do this with the other three plots without copying the data from the Games webpage again.

Figure 2: Actual single workout placing regressed against overall placing.

There are other weird artifacts that I’ve introduced with these data, but I think the problems cause my results and conclusions to be conservative. That is, if I had all the data, there would be more variation and unpredictability… If you’re interested in knowing how, comment or ask.

Bigger picture

This post presents more evidence that watching rankings closely early in an Open competition is of little value. Sure, it’s not going to  be easy or likely that one will qualify for Regionals after hitting >300th place in a single workout, and it will be harder if you’re ranked 150th after three workouts… but it’s been done before. This is, again, a reason to stay positive, and to strive to be better.

Update 3: Predicting regional competitors from single Open results

Here’s another contribution to my analyses of the CrossFit Open competition, and is continued from here, where I looked broadly at maximum and minimum placings among Open competitors,  and here, where I examined the frequency that athletes finished within the top 60 of a given Open workout and how that related to qualification for Regionals.

This particular post is an extention of my brief analysis examining probabilities of Regional qualification with top 50 finishes during the Open.

Remember

This post attempts to address (2): your chances of qualifying for Regionals with a particularly high Open placing.

I’m going to refer to “maximum placing” again, which seemed to cause some confusion in my past posts. Maximum  is highest absolute value. For instance, 398th is a higher place than 2nd place. So, “maximum” is “bad” if you’re interested in competing.

I’ve got plots to present, and I will summarize them in the last paragraph of this post.

Past probabilities of qualifying based on maximum  and minimum placings

So you’re interested in qualifying for Regionals, but 14.3 is a culmination of all of your weaknesses: triple-under, backflip, muscle-ups, while holding a perfect D-flat major. You compete, and finish as expected, but not to your liking. Do you still have a chance at qualifying?

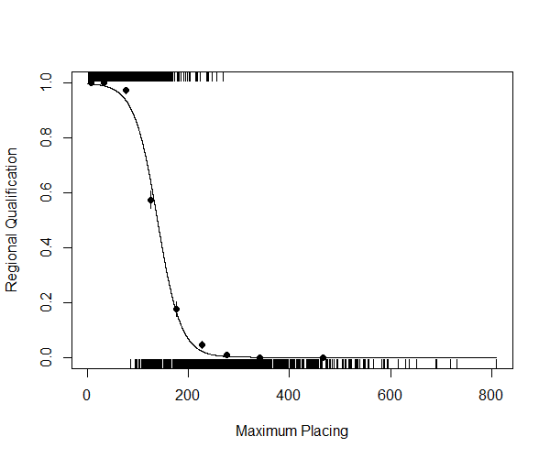
Fig. 1: Regional qualification (1 = Yes, 0 = No) of athletes with increasing maximum placings in a given open. The line represents a generalized linear model fitted to binomial qualification data, and predicted with maximum placings. Closed points are empirical probabilities with standard error.


Figure 1 is similar to what I presented in my previous post, but the x-axis has been replaced with Maximum Placing – the highest place value (remember, high is ‘bad’) an athlete received during a given Open competition.

Each little, vertical line represents one athlete, during one Open competition (1800 total), and it is placed on the bottom (y = 0) for non-regional qualifiers, and on the top (y = 1) for the Regional qualifiers. Where each line along the x-axis represents her maximum placing of the five workouts in a given Open.

Again, the curved line is what is interesting; more specifically, the rapid change illustrated by the curve. The line lets us estimate the chances of an individual qualifying for regionals, given a particular place in an Open workout – in this case, it’s the maximum place scored. As you move from a low maximum (<50th) to about 300th place, qualifying athletes drop dramatically. Let’s zoom in:

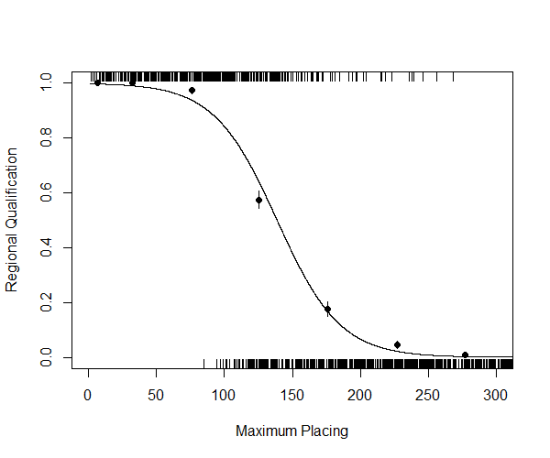
Fig. 2: A modified scaling of Figure 1 – the x-axis has been limited to < 350.

If we again follow the closed circles, which represent empirical probabilities that an athlete will qualify, athletes with a maximum placing below 50, have a 100% chance of qualifying, but those chances start dropping off quickly:

    • 97% with maximums below 100th
    • 57% with maximums below 150th
    • 18% with maximums below 200th,
    • 4% with maximums below 250th, and
    • 0.09 % by the time we reach a maximum of 300th place.

Summary

This is exactly what I found in my first post – get a score above 300th place and you’ll be breaking records if you qualify for Regionals. It’s very unlikely that you have a shot at that point…. But, I need to emphasize the limits of my dataset. These ‘probabilities’  are not actually probabilities (more accurately, they are estimates of the contribution of maximum placing to regional qualification taken from fitted models to past data), and they only apply if you happen to be a women, in one of the five regions listed in the first post… during Open years 2012 and 2013.

So, take these data with a grain of salt. In fact, take them only as encouragement, and a push to do better next time. The data simply show what has occurred in past Open competition (there have only been two), and one of the mantras of CrossFit is to always push harder and surprise yourself. If you finish 301st in 14.2, make me recalculate my estimates and make new plots. (is that motivating to anyone?)

Update 2: Predicting regional competitors from single Open results

Here’s another contribution to my analyses of the CrossFit Open competition, and is continued from here, where I looked broadly at maximum and minimum placings among Open competitors,  and here, where I examined the frequency that athletes finished within the top 60 of a given Open workout and how that related to qualification for Regionals.

A couple of notes

I want to be a little more explicit about the importance of (1) the frequency of placing within the Top 50 (yes, I’ve switch to top 50 from top 60… no real reason, but my first post discusses it a bit) during a given Open, and (2) your chances of qualifying for Regionals with a particularly high Open placing. This post will address (1), and the next post will address point (2).

I’m going to go back to “maximum placing”, which seemed to cause some confusion in my past posts. Maximum here is highest absolute value. For instance, 398th is a higher place than 2nd place. So, “maximum” is “bad” if you’re interested in competing.

I’ve got plots to present, and I will summarize them in the last paragraph of this post.

Past probabilities of qualifying based on frequencies of placing within the Top 50

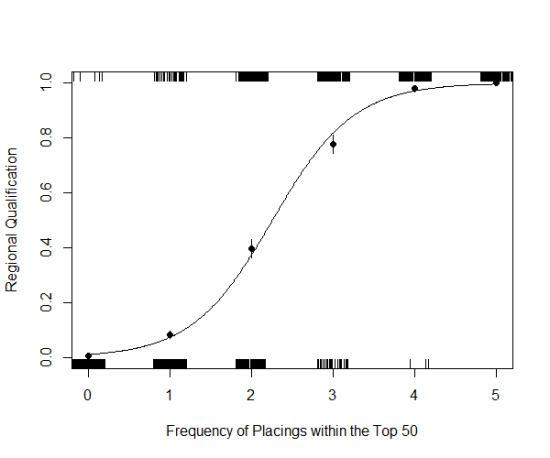
Fig. 1: Regional qualification (1 = Yes, 0 = No) of athletes who placed within the top 50 on 0 to 5 workouts in a given open. The line represents a generalized linear model fitted to binomial qualification data, and predicted with top 50 placings frequency. Closed points are empirical probabilities with standard error.

Figure 1 is another way of exploring how placing in the top 50 during a Open competition can affect an athletes probability of qualifying for Regionals.

There is a lot going on in the plot, so let’s build an explanation. Because of how math and statistics work, I have to code Regional Qualification as 0’s and 1’s. In a given Open competition, if an athlete qualified (i.e., her overall place was < 50), I assigned her a 1 for “Yes, qualified.” Conversely, athletes placing > 50, received a 0 for “No, didn’t qualify.” These 0’s and 1’s are plotted along the top and bottom of the graph – each tiny, vertical, line is one, individual athlete during one of the two Open competitions I had in my data set. There are so many, very tightly packed lines together that some times it looks like a big, solid line. For example, the little lines are distributed along the x-axis according to how many times that athlete placed in the top 50 during the Open (from 0 to 5 times). There are a lot of athletes who never placed within the top 50, so there appears to be a solid line above the ‘0’ on the x-axis.

The curved line is the cool thing. It’s a model fitted to the regional qualification data that lets one estimate the probability an athlete will qualify for Regionals as she accumulates top 50 placings in an Open. So, as I’m writing this, a number of athletes have placed within the top 50 in the 2014 Open for both released workouts, including Emily Bridgers. Assuming she drops out of the top 50 for the other 3 workouts, she’s still got a 40% of making it.

And that’s what the closed points are – empirical probabilities, which I can use to assess how well the line fits the data (the points should be, and are, pretty close to the line). Starting from the point on the left, the points fall at 0.6%, 8.2%, 40.0%, 77.6%, 98.0%, and 100%. These values are with respect to the number of times an athlete finished top 50 in an Open.

So, you finish 5 times within the top 50 – you’re obviously golden; you will qualify for Regionals. You never qualify in the top 50… wait, you still have a 0.6% chance! (beware, this is only taken from women who finished top 180… and no other variables are accounted for… like maximum placing).

Summary

Here’s the interesting part: rapid change. The line in Figure 1 rapidly curves up, illustrating that as one accumulates top 50 placings during an Open, chances of making it to Regional rapidly increases.  In fact, finish top 50 once, and my subset of data suggest you have an 8% chance of making it.  Finish twice, on the other hand, and your chances jump up 32% (totaling 40%). With three top 50 finishes, another 37% jump (totaling 77%)!

Update 1: Predicting regional competitors from single Open results

UPDATE – 5 March 2014 – Continued from previous post.

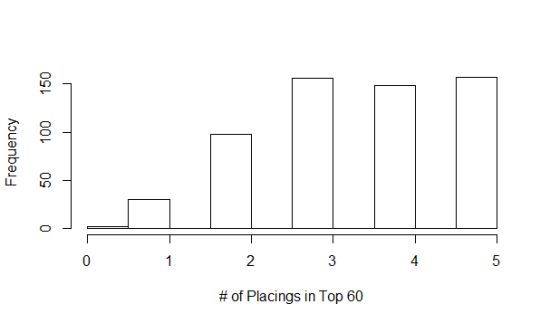
Here are a couple of historgrams illustrating the frequency of top 60 placings for competitors in a given year and region. So, an athelete, say, Emily Bridgers, completes 5 workouts during an Open. How often does she place in the top 60 during that Open event? 5 of 5 times. I wanted to consider this for 1800 athletes, 600 of which  finished in the top 60 over two years and five regions.

So, how many athletes did the same as Emily, finishing 5 of 5 workouts in the top 60? 150 (Fig. 3). Yes, there are duplicates – Emily did this (5 for 5) both years, and it’s counted as two ‘separate’ athletes in the estimate. There are other criticisms one can provide, and maybe I’ll consider them… but here’s a summary of the data I’m talking about:

Fig. 3: Frequency of placings in the top 60 for the top 60 Open finishers.
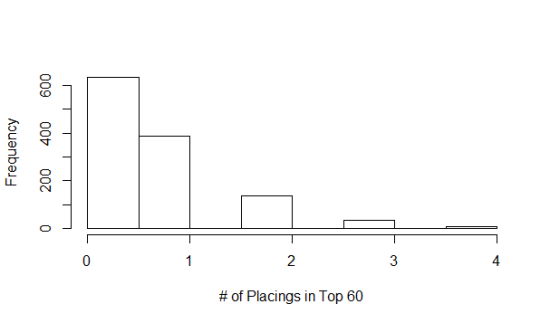
Fig. 4: Frequency of placings in the top 60 for athletes finishing from 60 to 180 during the Open.

I split the rankings into two groups: the Top 60 finishers (Fig. 3) and athletes that finished between 61st and 180th (Fig. 4). Within the top 60, the  majority of athletes placed within the top 60 during five open workouts at least 3 times – about 450 of 600 did this. About 100 athletes finishing in the top 60 placed within the top 60 twice during a given Open, and a handful (~45) even did this once. In fact, there were two athletes that never finished within the top 60, and finished with an overall placing of 56th and 58th… Why? Because their placings were consistently between 62 and 140. They never had a bad workout.

That said, look at Fig. 4. There were nearly 400 athletes that placed in the top 60 during an Open, but placed overall between 61st and 180th. 400 of 1200 athletes. So the Open works both ways, and this is supported by Fig. 2 (look at the right side of the graph… see how many points there are really close to the x-axis) and Fig 4., one good work out will not guarantee you a spot at Regionals, and one bad one won’t guarantee you’re knocked out of the running.

These results suggest that Regional qualification is weighted heavily in performance consistency during an Open. I would like to point out the sliver on Fig. 4, representing the number of athletes (six of them) finishing FOUR of five workouts within the top 60… and still being booted from the top 60 overall. This says, don’t screw up too badly on a single work out. And by too badly, the highest place for these six athletes: 304, 279, 395, 394, 511, and 449.

Maybe more to come… I started an R script…

Predicting regional competitors from single Open results

Let’s get this straight. The CrossFit Open is five workouts for a reason: a single result does not accurately predict whether you’ll be headed to the Regional competition, and Open results have even less predictive power for Games competitors. There is more to being the “Fittest on Earth” than performing well on a single, 10 minute, AMRAP.

Sure, these statements seem obvious. But I’m a scientist, and I like numbers. And, frankly, sometimes my wife is hysterical about her performance, to the point where she throws out words like ‘impossible’ after completing a single Open workout and not performing to her liking. So, I set out to look at some data, and challenge myself to calculate some probabilities (’cause this is how I show my affection…). I’m writing as I work (or waste time…), and I’m not confident that I can attain my goal, that is, to provide a probability distribution of qualifying for Regional competitions (~ top 50 Open competitors from each region), given a result from a single Open workout. I may just provide some graphs and a few numbers that suggest the first paragraph in this post is true, without actually getting to this distribution thing. After all, I’m an ecologist, am more or less self taught in statistics and probability, and I have a job. Plus, I like playing fetch with my dogs.

I’ve taken results from the 2012 and 2013 Open competitions from the top 180 finishing women in five US regions: South East, Central East, South West, Southern California, and Norther California. There’s much more data to be copied than what I’m working with, but I think these data are representative of the whole, and I couldn’t figure out how to access raw data without copy-paste.

From memory: In 2012, the top 60 went to Regionals, while in 2013 the top 48 were selected. Similarly, the top 48 will be selected in 2014. I’m rounding the selection to 50, given that there are probably a few qualifiers that will compete in a team or decline all together. This is likely a conservative selection cut-off.

A few plots

(I’m not proud of these – they are quick and dirty Excel ‘charts’… don’t tell my students).

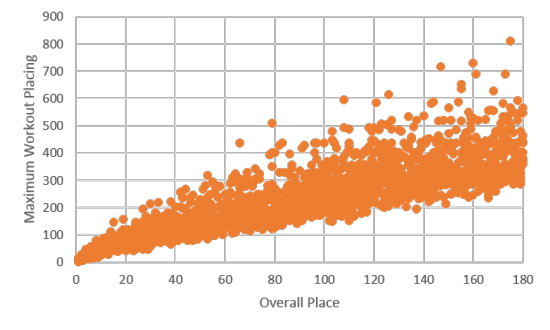
Fig. 1: Maximum workout placing across all five workouts for two years and five regions (women only).

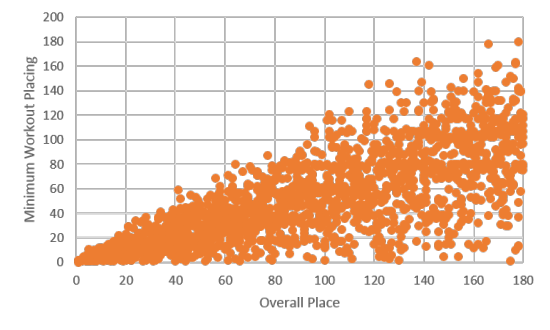
Fig. 2: Minimum workout placing across all five workouts for two years and five regions (women only).

The first couple of plots are simple: of the top 180 women in five regions and across two years of the Open, what were their maximum and minimum placings? There is a lot of variation in both plots, and I was tempted to conclude that the scoring method of the Open, which is used to calculated the overall placing (x-axis), was weighted heavier for the maximum placing. I think I’d have to calculate a coefficient of variation to be sure though, given that the scales on the y-axis are pretty different for the two plots.

Bigger picture

There were no qualifying athletes (top 50) who placed higher than 268 in any one workout, and the average maximum placing was 90. Further, all qualifying athletes scored at least one workout below 60th place, with an average minimum placing of about 15th. What this means to me is that if you want to qualify, don’t have any placings above 300, and place within the top 50 at least once (probably more… maybe that’ll be the next calculation: number of workouts placed in top 50 or 60). I round these numbers a bit for a couple reasons: (1) there are more competitors this year, and (2) the I suspect consistency (below top 60) is more important here.