Update 3: Predicting regional competitors from single Open results

Here’s another contribution to my analyses of the CrossFit Open competition, and is continued from here, where I looked broadly at maximum and minimum placings among Open competitors,  and here, where I examined the frequency that athletes finished within the top 60 of a given Open workout and how that related to qualification for Regionals.

This particular post is an extention of my brief analysis examining probabilities of Regional qualification with top 50 finishes during the Open.

Remember

This post attempts to address (2): your chances of qualifying for Regionals with a particularly high Open placing.

I’m going to refer to “maximum placing” again, which seemed to cause some confusion in my past posts. Maximum  is highest absolute value. For instance, 398th is a higher place than 2nd place. So, “maximum” is “bad” if you’re interested in competing.

I’ve got plots to present, and I will summarize them in the last paragraph of this post.

Past probabilities of qualifying based on maximum  and minimum placings

So you’re interested in qualifying for Regionals, but 14.3 is a culmination of all of your weaknesses: triple-under, backflip, muscle-ups, while holding a perfect D-flat major. You compete, and finish as expected, but not to your liking. Do you still have a chance at qualifying?
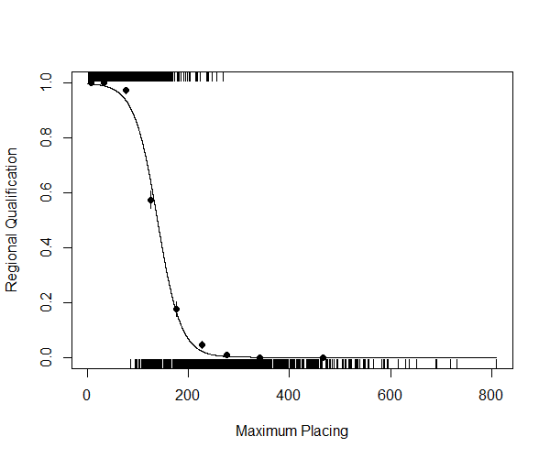
Fig. 1: Regional qualification (1 = Yes, 0 = No) of athletes with increasing maximum placings in a given open. The line represents a generalized linear model fitted to binomial qualification data, and predicted with maximum placings. Closed points are empirical probabilities with standard error.


Figure 1 is similar to what I presented in my previous post, but the x-axis has been replaced with Maximum Placing – the highest place value (remember, high is ‘bad’) an athlete received during a given Open competition.

Each little, vertical line represents one athlete, during one Open competition (1800 total), and it is placed on the bottom (y = 0) for non-regional qualifiers, and on the top (y = 1) for the Regional qualifiers. Where each line along the x-axis represents her maximum placing of the five workouts in a given Open.

Again, the curved line is what is interesting; more specifically, the rapid change illustrated by the curve. The line lets us estimate the chances of an individual qualifying for regionals, given a particular place in an Open workout – in this case, it’s the maximum place scored. As you move from a low maximum (<50th) to about 300th place, qualifying athletes drop dramatically. Let’s zoom in:
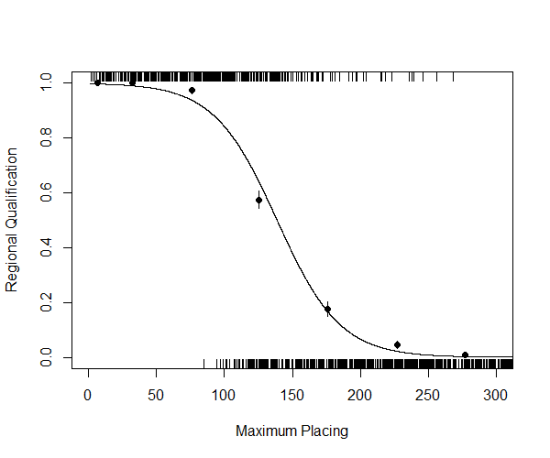
Fig. 2: A modified scaling of Figure 1 – the x-axis has been limited to < 350.

If we again follow the closed circles, which represent empirical probabilities that an athlete will qualify, athletes with a maximum placing below 50, have a 100% chance of qualifying, but those chances start dropping off quickly:

    • 97% with maximums below 100th
    • 57% with maximums below 150th
    • 18% with maximums below 200th,
    • 4% with maximums below 250th, and
    • 0.09 % by the time we reach a maximum of 300th place.

Summary

This is exactly what I found in my first post – get a score above 300th place and you’ll be breaking records if you qualify for Regionals. It’s very unlikely that you have a shot at that point…. But, I need to emphasize the limits of my dataset. These ‘probabilities’  are not actually probabilities (more accurately, they are estimates of the contribution of maximum placing to regional qualification taken from fitted models to past data), and they only apply if you happen to be a women, in one of the five regions listed in the first post… during Open years 2012 and 2013.

So, take these data with a grain of salt. In fact, take them only as encouragement, and a push to do better next time. The data simply show what has occurred in past Open competition (there have only been two), and one of the mantras of CrossFit is to always push harder and surprise yourself. If you finish 301st in 14.2, make me recalculate my estimates and make new plots. (is that motivating to anyone?)

Update 2: Predicting regional competitors from single Open results

Here’s another contribution to my analyses of the CrossFit Open competition, and is continued from here, where I looked broadly at maximum and minimum placings among Open competitors,  and here, where I examined the frequency that athletes finished within the top 60 of a given Open workout and how that related to qualification for Regionals.

A couple of notes

I want to be a little more explicit about the importance of (1) the frequency of placing within the Top 50 (yes, I’ve switch to top 50 from top 60… no real reason, but my first post discusses it a bit) during a given Open, and (2) your chances of qualifying for Regionals with a particularly high Open placing. This post will address (1), and the next post will address point (2).

I’m going to go back to “maximum placing”, which seemed to cause some confusion in my past posts. Maximum here is highest absolute value. For instance, 398th is a higher place than 2nd place. So, “maximum” is “bad” if you’re interested in competing.

I’ve got plots to present, and I will summarize them in the last paragraph of this post.

Past probabilities of qualifying based on frequencies of placing within the Top 50

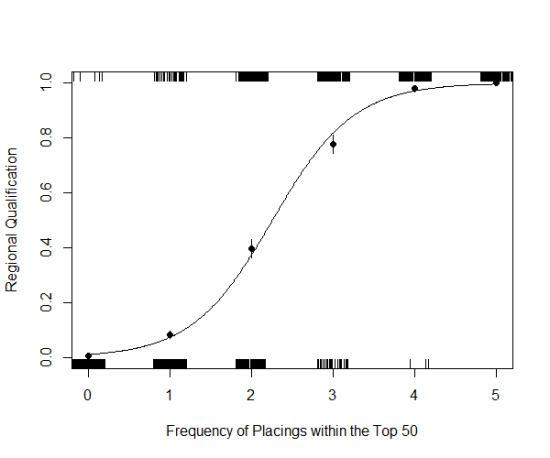
Fig. 1: Regional qualification (1 = Yes, 0 = No) of athletes who placed within the top 50 on 0 to 5 workouts in a given open. The line represents a generalized linear model fitted to binomial qualification data, and predicted with top 50 placings frequency. Closed points are empirical probabilities with standard error.

Figure 1 is another way of exploring how placing in the top 50 during a Open competition can affect an athletes probability of qualifying for Regionals.

There is a lot going on in the plot, so let’s build an explanation. Because of how math and statistics work, I have to code Regional Qualification as 0’s and 1’s. In a given Open competition, if an athlete qualified (i.e., her overall place was < 50), I assigned her a 1 for “Yes, qualified.” Conversely, athletes placing > 50, received a 0 for “No, didn’t qualify.” These 0’s and 1’s are plotted along the top and bottom of the graph – each tiny, vertical, line is one, individual athlete during one of the two Open competitions I had in my data set. There are so many, very tightly packed lines together that some times it looks like a big, solid line. For example, the little lines are distributed along the x-axis according to how many times that athlete placed in the top 50 during the Open (from 0 to 5 times). There are a lot of athletes who never placed within the top 50, so there appears to be a solid line above the ‘0’ on the x-axis.

The curved line is the cool thing. It’s a model fitted to the regional qualification data that lets one estimate the probability an athlete will qualify for Regionals as she accumulates top 50 placings in an Open. So, as I’m writing this, a number of athletes have placed within the top 50 in the 2014 Open for both released workouts, including Emily Bridgers. Assuming she drops out of the top 50 for the other 3 workouts, she’s still got a 40% of making it.

And that’s what the closed points are – empirical probabilities, which I can use to assess how well the line fits the data (the points should be, and are, pretty close to the line). Starting from the point on the left, the points fall at 0.6%, 8.2%, 40.0%, 77.6%, 98.0%, and 100%. These values are with respect to the number of times an athlete finished top 50 in an Open.

So, you finish 5 times within the top 50 – you’re obviously golden; you will qualify for Regionals. You never qualify in the top 50… wait, you still have a 0.6% chance! (beware, this is only taken from women who finished top 180… and no other variables are accounted for… like maximum placing).

Summary

Here’s the interesting part: rapid change. The line in Figure 1 rapidly curves up, illustrating that as one accumulates top 50 placings during an Open, chances of making it to Regional rapidly increases.  In fact, finish top 50 once, and my subset of data suggest you have an 8% chance of making it.  Finish twice, on the other hand, and your chances jump up 32% (totaling 40%). With three top 50 finishes, another 37% jump (totaling 77%)!