Update 1: Predicting regional competitors from single Open results

UPDATE – 5 March 2014 – Continued from previous post.

Here are a couple of historgrams illustrating the frequency of top 60 placings for competitors in a given year and region. So, an athelete, say, Emily Bridgers, completes 5 workouts during an Open. How often does she place in the top 60 during that Open event? 5 of 5 times. I wanted to consider this for 1800 athletes, 600 of which  finished in the top 60 over two years and five regions.

So, how many athletes did the same as Emily, finishing 5 of 5 workouts in the top 60? 150 (Fig. 3). Yes, there are duplicates – Emily did this (5 for 5) both years, and it’s counted as two ‘separate’ athletes in the estimate. There are other criticisms one can provide, and maybe I’ll consider them… but here’s a summary of the data I’m talking about:
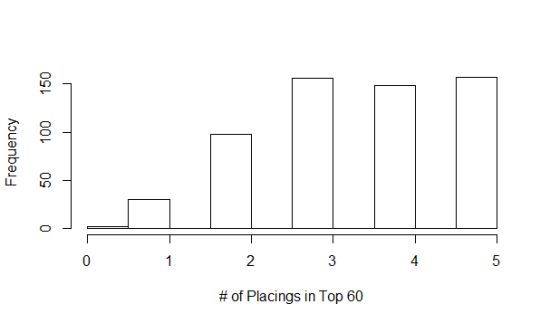
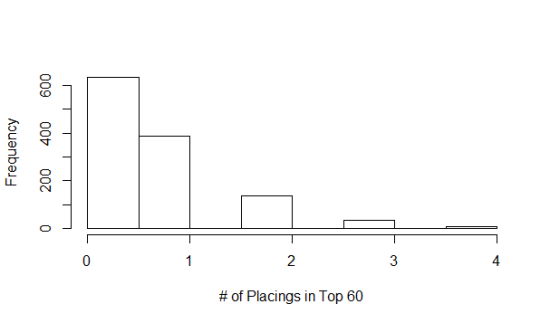
Fig. 3: Frequency of placings in the top 60 for the top 60 Open finishers.
Fig. 4: Frequency of placings in the top 60 for athletes finishing from 60 to 180 during the Open.

I split the rankings into two groups: the Top 60 finishers (Fig. 3) and athletes that finished between 61st and 180th (Fig. 4). Within the top 60, the  majority of athletes placed within the top 60 during five open workouts at least 3 times – about 450 of 600 did this. About 100 athletes finishing in the top 60 placed within the top 60 twice during a given Open, and a handful (~45) even did this once. In fact, there were two athletes that never finished within the top 60, and finished with an overall placing of 56th and 58th… Why? Because their placings were consistently between 62 and 140. They never had a bad workout.

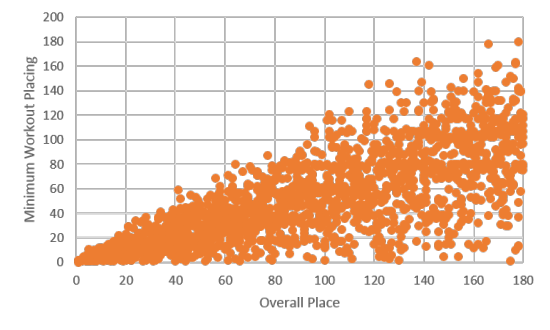
That said, look at Fig. 4. There were nearly 400 athletes that placed in the top 60 during an Open, but placed overall between 61st and 180th. 400 of 1200 athletes. So the Open works both ways, and this is supported by Fig. 2 (look at the right side of the graph… see how many points there are really close to the x-axis) and Fig 4., one good work out will not guarantee you a spot at Regionals, and one bad one won’t guarantee you’re knocked out of the running.

These results suggest that Regional qualification is weighted heavily in performance consistency during an Open. I would like to point out the sliver on Fig. 4, representing the number of athletes (six of them) finishing FOUR of five workouts within the top 60… and still being booted from the top 60 overall. This says, don’t screw up too badly on a single work out. And by too badly, the highest place for these six athletes: 304, 279, 395, 394, 511, and 449.

Maybe more to come… I started an R script…

Predicting regional competitors from single Open results

Let’s get this straight. The CrossFit Open is five workouts for a reason: a single result does not accurately predict whether you’ll be headed to the Regional competition, and Open results have even less predictive power for Games competitors. There is more to being the “Fittest on Earth” than performing well on a single, 10 minute, AMRAP.

Sure, these statements seem obvious. But I’m a scientist, and I like numbers. And, frankly, sometimes my wife is hysterical about her performance, to the point where she throws out words like ‘impossible’ after completing a single Open workout and not performing to her liking. So, I set out to look at some data, and challenge myself to calculate some probabilities (’cause this is how I show my affection…). I’m writing as I work (or waste time…), and I’m not confident that I can attain my goal, that is, to provide a probability distribution of qualifying for Regional competitions (~ top 50 Open competitors from each region), given a result from a single Open workout. I may just provide some graphs and a few numbers that suggest the first paragraph in this post is true, without actually getting to this distribution thing. After all, I’m an ecologist, am more or less self taught in statistics and probability, and I have a job. Plus, I like playing fetch with my dogs.

I’ve taken results from the 2012 and 2013 Open competitions from the top 180 finishing women in five US regions: South East, Central East, South West, Southern California, and Norther California. There’s much more data to be copied than what I’m working with, but I think these data are representative of the whole, and I couldn’t figure out how to access raw data without copy-paste.

From memory: In 2012, the top 60 went to Regionals, while in 2013 the top 48 were selected. Similarly, the top 48 will be selected in 2014. I’m rounding the selection to 50, given that there are probably a few qualifiers that will compete in a team or decline all together. This is likely a conservative selection cut-off.

A few plots

(I’m not proud of these – they are quick and dirty Excel ‘charts’… don’t tell my students).

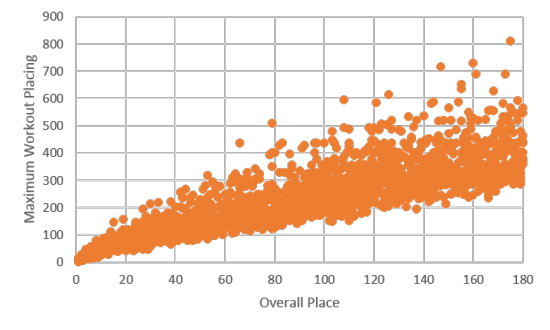
Fig. 1: Maximum workout placing across all five workouts for two years and five regions (women only).

Fig. 2: Minimum workout placing across all five workouts for two years and five regions (women only).

The first couple of plots are simple: of the top 180 women in five regions and across two years of the Open, what were their maximum and minimum placings? There is a lot of variation in both plots, and I was tempted to conclude that the scoring method of the Open, which is used to calculated the overall placing (x-axis), was weighted heavier for the maximum placing. I think I’d have to calculate a coefficient of variation to be sure though, given that the scales on the y-axis are pretty different for the two plots.

Bigger picture

There were no qualifying athletes (top 50) who placed higher than 268 in any one workout, and the average maximum placing was 90. Further, all qualifying athletes scored at least one workout below 60th place, with an average minimum placing of about 15th. What this means to me is that if you want to qualify, don’t have any placings above 300, and place within the top 50 at least once (probably more… maybe that’ll be the next calculation: number of workouts placed in top 50 or 60). I round these numbers a bit for a couple reasons: (1) there are more competitors this year, and (2) the I suspect consistency (below top 60) is more important here.